2.Headway Curve Handling |
Drugging the graph scrolls it to x-y direction.
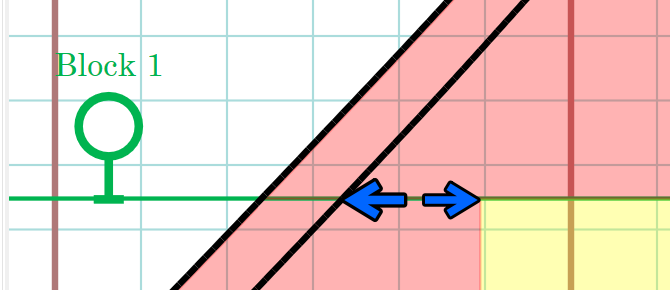
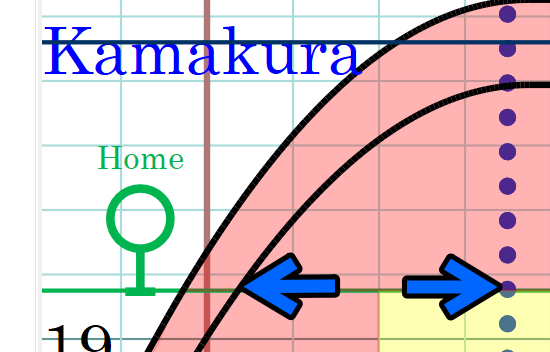
Dragging with the mouse wheel displays the following train's headway curve and you can move it horizontally.
Turning the mouse wheel will zoom in or out.
The blue arrowed slider zoom in or out horizontally.
The green arrowed slider scrolls the graph vertically.
The red arrowed slider zoom in and out vertically.
The yellow arrowed slider zoom in and out.
Home key will jump to the starting position and End key to the terminal position.
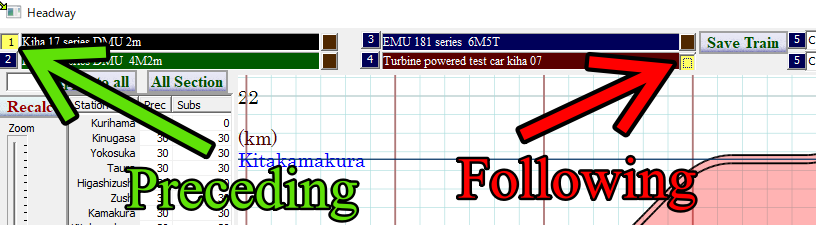
2 buttons at the both side of the train title bar do this.
The left side button assigns the train to the preceding train and the right side button assigns the train to the following train.
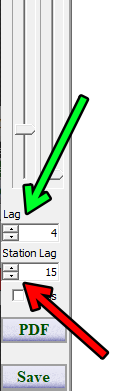
Green arrowed controls change the lag time between the preceding train passes through a signal and the operator of the following train can recognize the signal. This includes the time lag of changing a signal aspect and the operator's perception lag.
Red arrowd controls change the lag time between the preceding train passes through a home signal and the operator of the following train can recognize the signal. This includes the time lag of changing a signal aspect and the operator's perception.
This lag will be the reference when manually controlling the following train to go ahead the preceding train at the station.with passing loop.
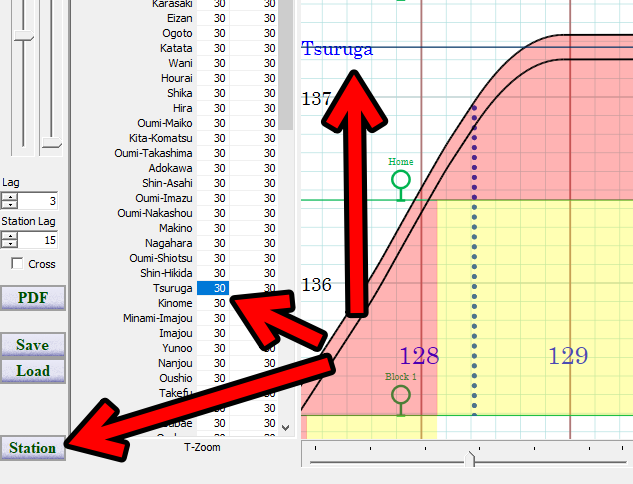
The initial value of stoppage time of all intermediate stations are set 30 seconds.To change the stoppage time of all intermediate stations, input the value at the red arrowed edit box and then click [Apply All] button.
To change the stoppage time at each station, edit the value n the grid When the grid data is changed, the graph automatically redrawn.

After changing the stoppage time, click [Recalc] button or press [Page Down] key to calculate the minimum headway time.
To save the edited data, click [Save] button.
To read the saved data, click Read] button.
When the file of different route is selected, the warning will be displayed.
Select the target station's time cell of the stoppage time list and click [Station] button shown below.Or press [Page Up] key to do this.
Drag the grid and select the stoppage time within the section to evaluate.
Then click "Recalc" button.

Click "PDF" button to turn the currently displayed graph on the screen into pdf file.
The running data derived from the runcurve can be saved to files here and reused.
So that the running data of the train stopping at different stations can be evaluated.
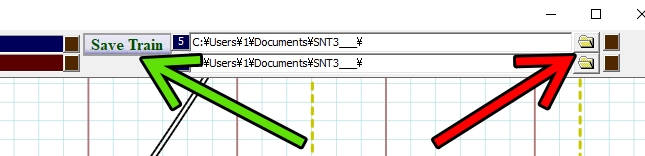
Click the green arrowed [Save Train] button to save. The file save dialog is displayed and input the file name. The saved file has the name consist of the header, the train name and file extension.
You can specify the header part at the file dialog.
To reuse them, click the red arrowed icon and select the file to reuse. Train data that run in the different route cannot be loaded.
The loaded file is treated as "train 5" or "train 6" and can be assigned to the preceding or the following in the same way shown above.
Right click the graph and select the color combination on the pop up menu.
©2021 JETconnect Co,. LTD All rights reserved.