
The running resistance is specified by selecting one formula and its
coefficients.
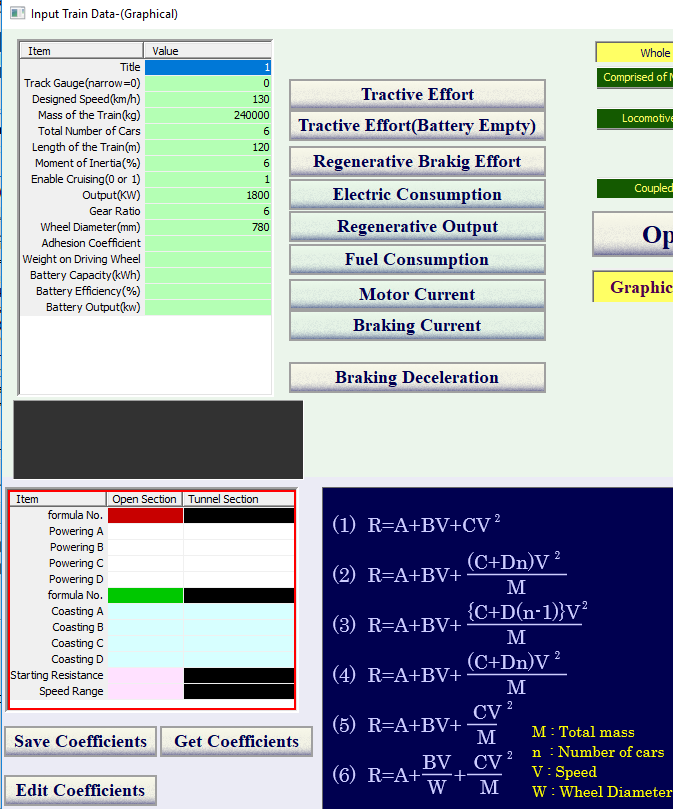
There are six formulas and three to four coefficients are required for each.
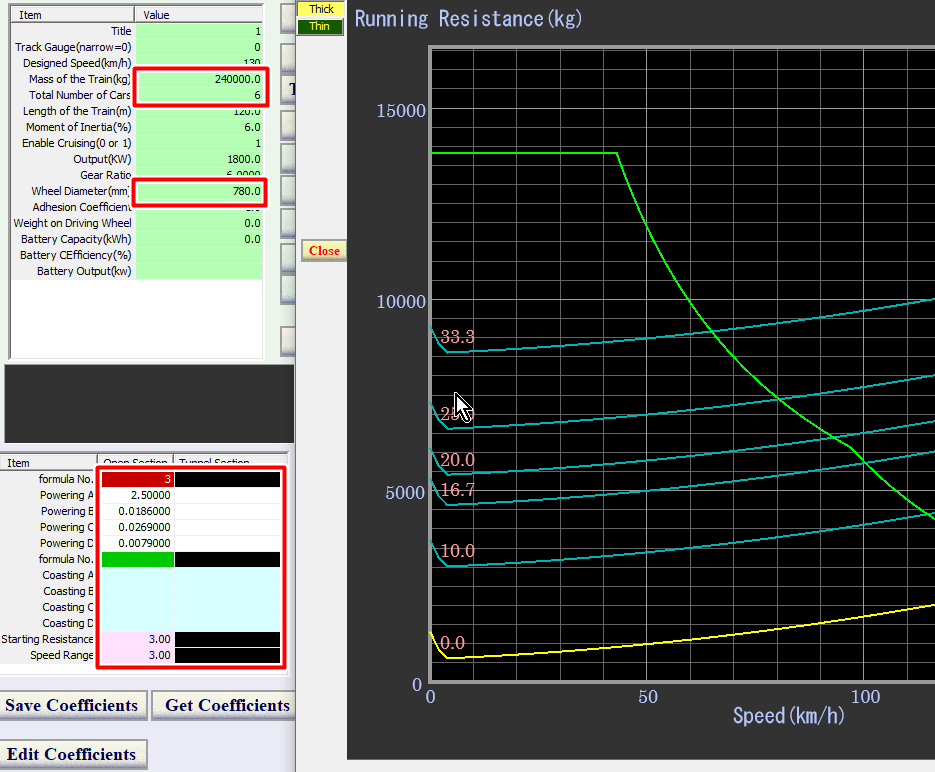
These data are set at the lower left area surrounded by the blinking red frame
shown below..
Default coefficients of typical trains can be applied by buttons arranged at the right side.
Notice: "High Speed 1" specifies coefficients of Shinkansen 0
series and this resistance data cannot be applicable over about 250 km/h.
As this data includes the intrinsic cooling fan resistance of driving motors, the
excessive resistance value is calculated at the high speed range.
The first step is to specify the running resistance formula.
Click the cell at the right side of "formula No" on the grid and then input the
formula number shown right side of the input area.
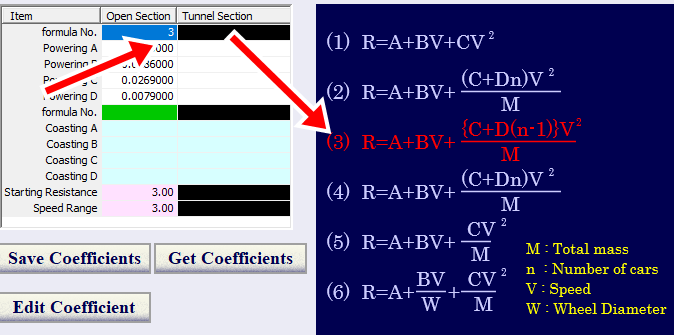
And then input coefficients from A to D as needed.
If the resistance of the powering state and the coasting state are not
distinguished, keep the coasting area empty.
And if the resistance of the open section and that of the tunnel section are the
same, keep the
tunnel section column empty.
The value of "Starting Resistance" row is the starting resistance
at speed 0.
Its unit is kg/t or kN/t according to the unit selection. The preset is 3kg/t.
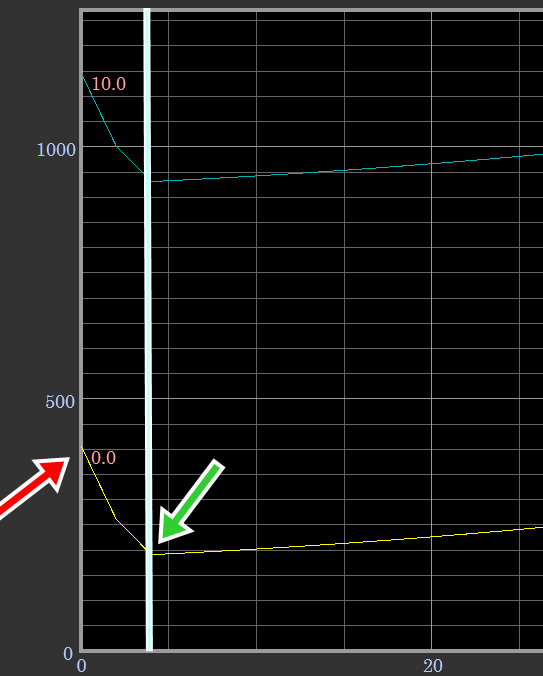
The value of "Speed Range" is the speed where the starting
resistance and the running resistance coincide with. (green arrowed point shown
above)
The preset value is 3km/h.
Click "Save Coefficients" button and then the next dialog box is displayed.
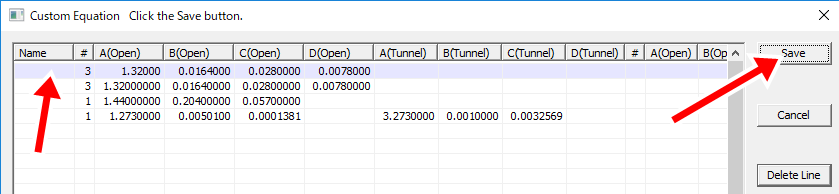
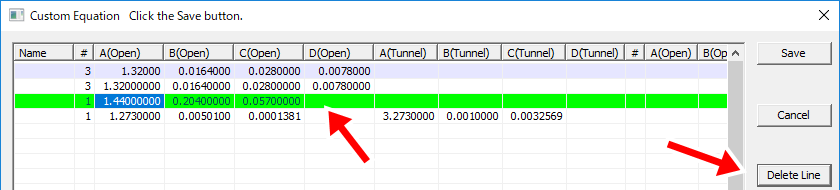
The data currently editing is at the top line of the list. Click the left red
arrowed cell and input there the title of this data.
Then click "Save" button.
If you want to delete some data, click the line to delete and click "Delete Line" button shown below.
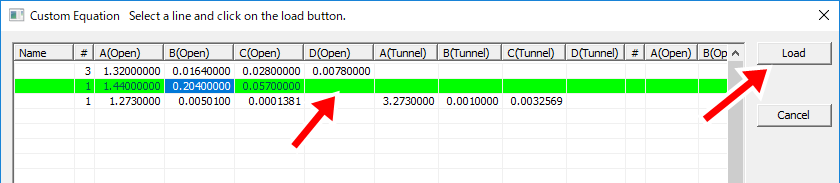
Click "Get Coefficients" button and then the next dialog box is displayed.
Click the data you want to load and then click "Load" button.
Click "Edit Coefficients" button and then the next dialog box is
displayed.
The yellow curve is the resistance at the flat track and sky blue curves are by
grades. The unit of grades are permillage.
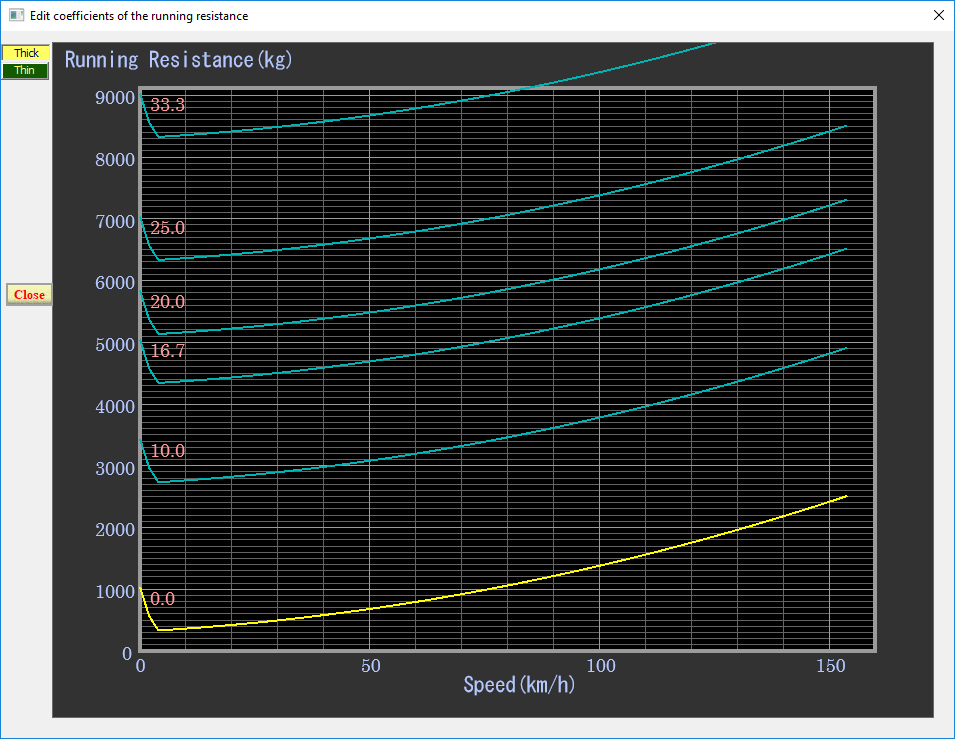
To change the thickness of the curve, click "Thick" button or
"Thin" button.
To zoom in/out vertically, drag the left area of the vertical axis.
To zoom in/out horizontally, drag the lower area of the horizontal axis.
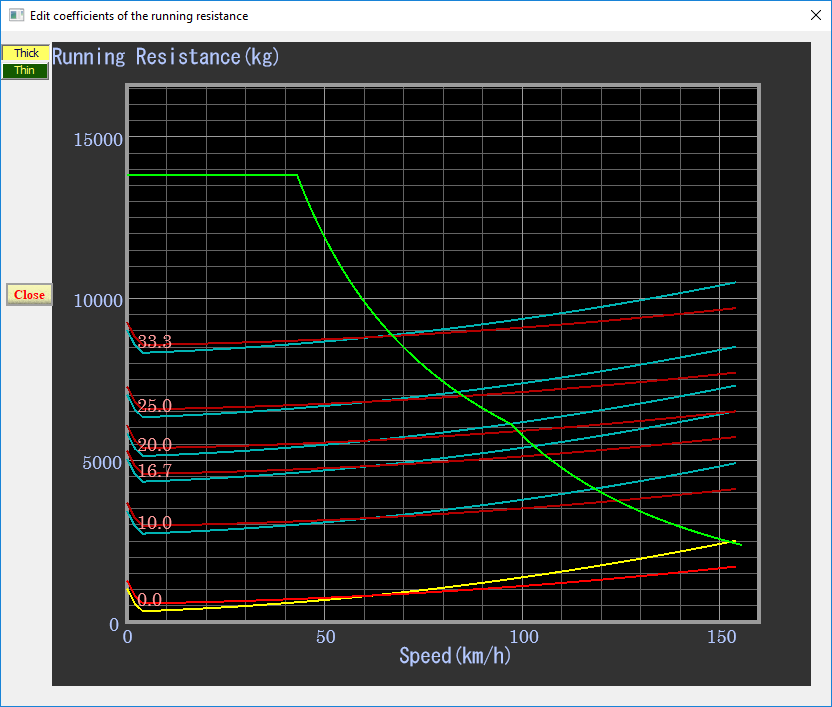
If the tractive effort has already been input, it is overlayed on the graph.
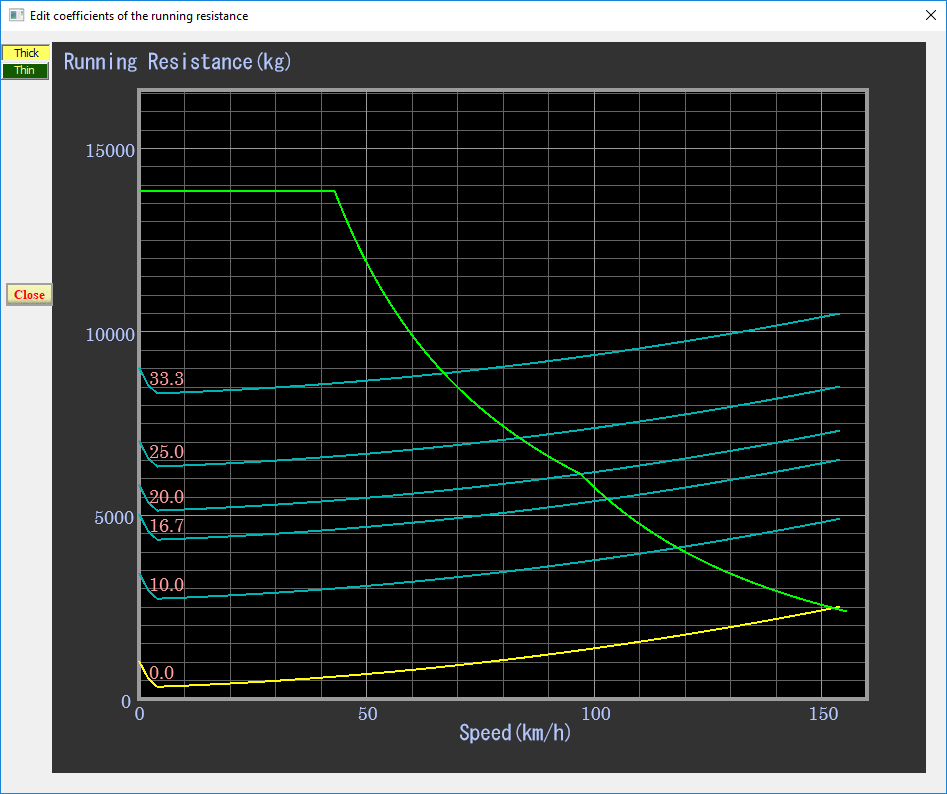
If the resistance while coasting has been input, it is overlayed with red color on the graph.
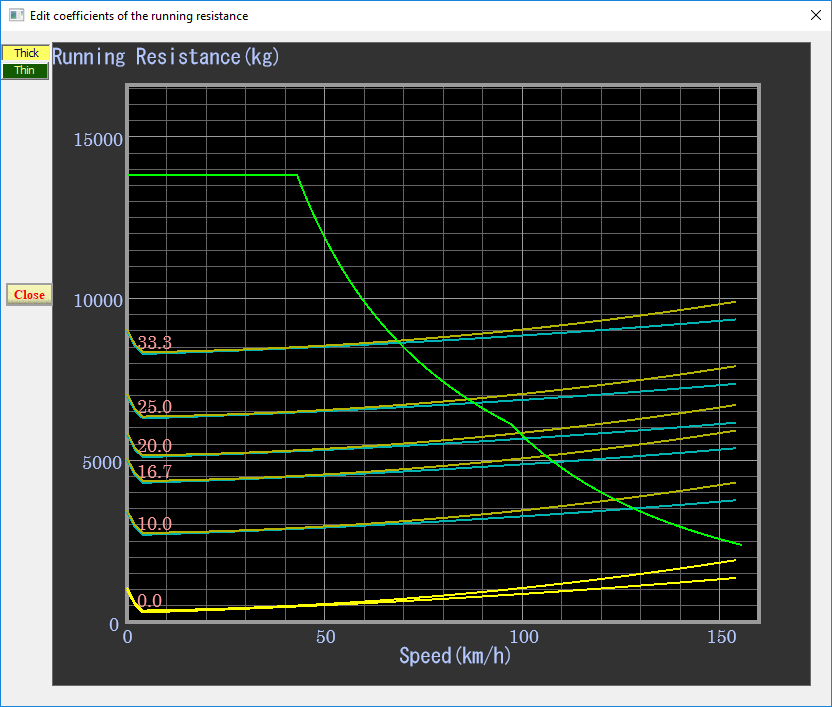
If the resistance data at "Tunnel Section" is added, resistance curves are overlayed like this.
When data at red framed areas show below are changed, the graph changes simultaneously.
©2021 JETconnect Co,. LTD All rights reserved.