fixed position jetconnect-logo

1.Display headway curves

The distance data of the track profile must be the actual measurement value and in ascending sorted order.

All signals are three postion signals and must be arranged in the order shown below.

Station Starting ---Block(N)---Block(N-1) - - - Block(1)---Home Station Starting---

Make a running curve with a track data that contains signal data.

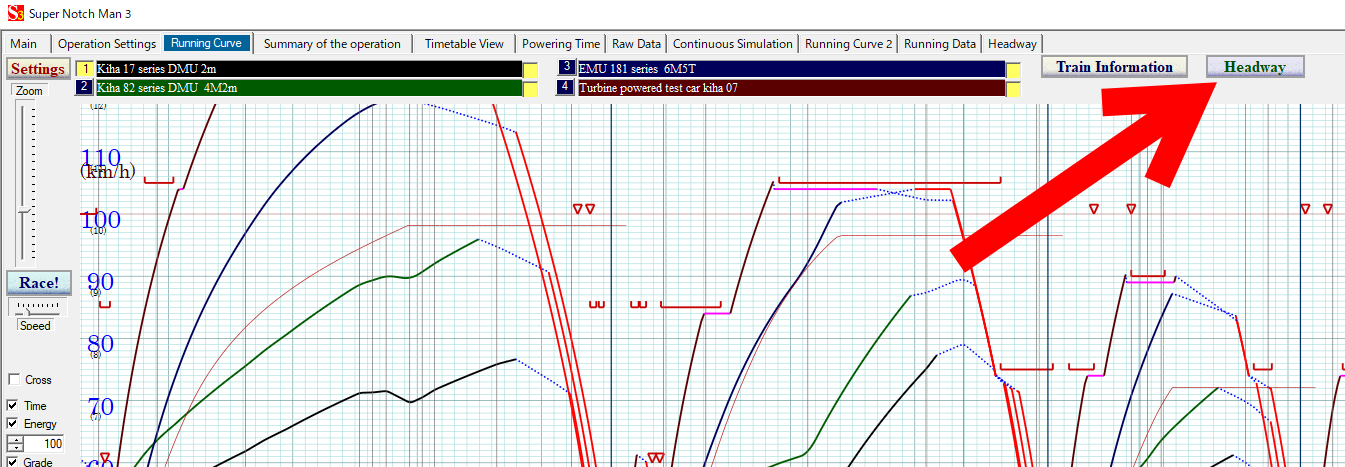
While a running curve is displayed, click "Headway" button shown below.


At initial state, train 1 is used as a preceding and following train.

If you drug within the headway graph area, the minimum headway time is calculated and the position where the minimum value is derived is displayed.

Pale red areas indicate the signal aspect "stop" and yellow areas indicate "caution" brought about by the preceding train.


                                                                     ©2021 JETconnect Co,. LTD All rights reserved.