
4.Numerical Output of Running Curve |
Instead of graphical output, Super Notch Man provides four numerical output formats.
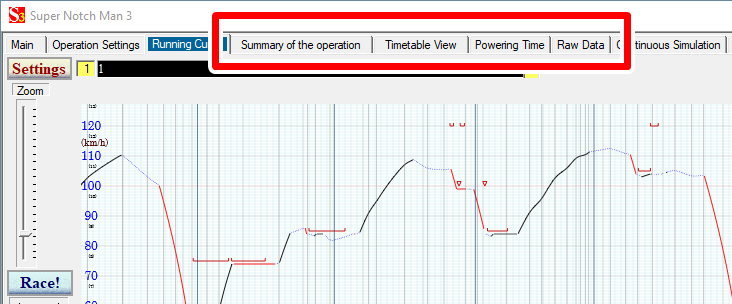
After generating the running curve, click tabs in the red frame shown blelow..
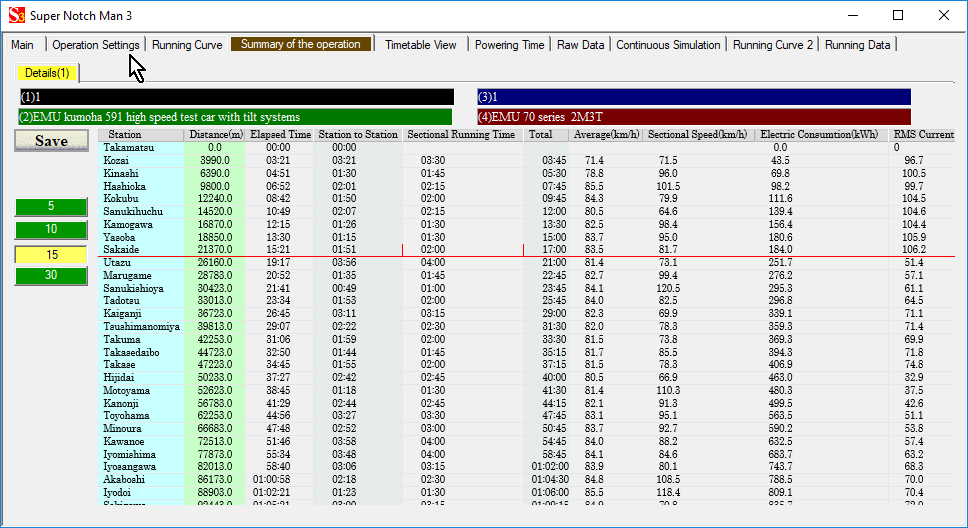
Click "Summary of the operation" tab and then the data list is displayed shown below.
| Scrolling | Dragging by mouse Rotating mouse wheel Arrow key Page up and Page down key |
| Zoom in/out | Rotating mouse wheel with pressing the Ctrl key |
| Go to the top line | Home key |
| Go to the bottom line | End key |
Buttons in the red frame below specify the unit of the sectional speed time. Default value is 15.
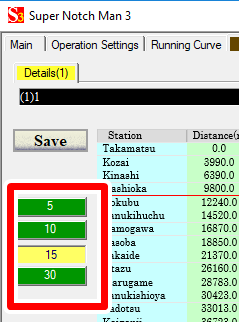
To save this data in CSV format, click "Save" button.
The file explorer is displayed and you can specify a file name to save.
When multiple trains are selected and simulated, the list is displayed like this.
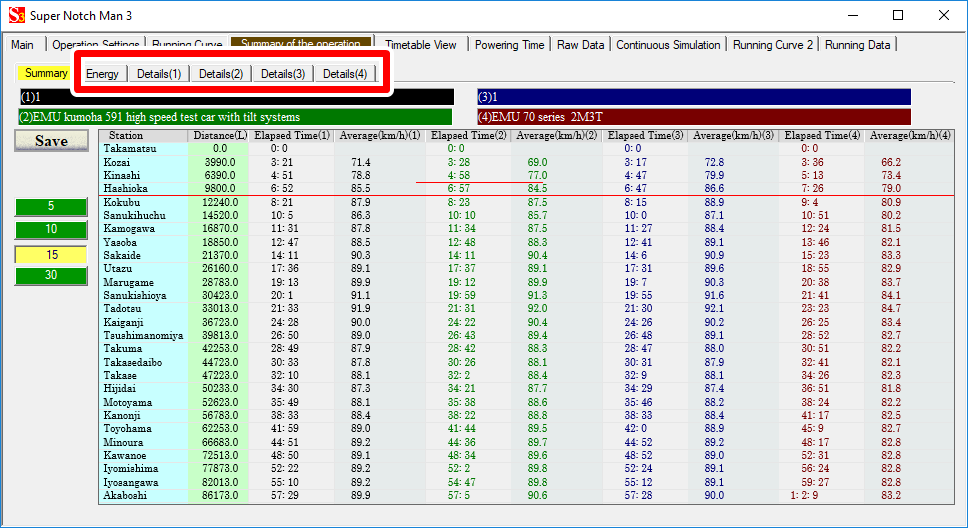
Specified 3 data of each train is shown simultaneously in the same list. Other data of each train can be displayed by clicking tabs in the red frame above.
Click "Timetable view", then the timetable like list is displayed shown below.
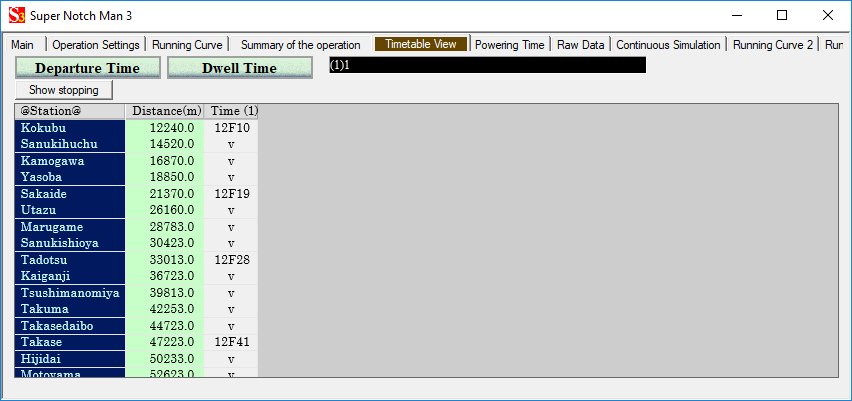
The operation time is calculated using the sectional speed time (15 seconds).
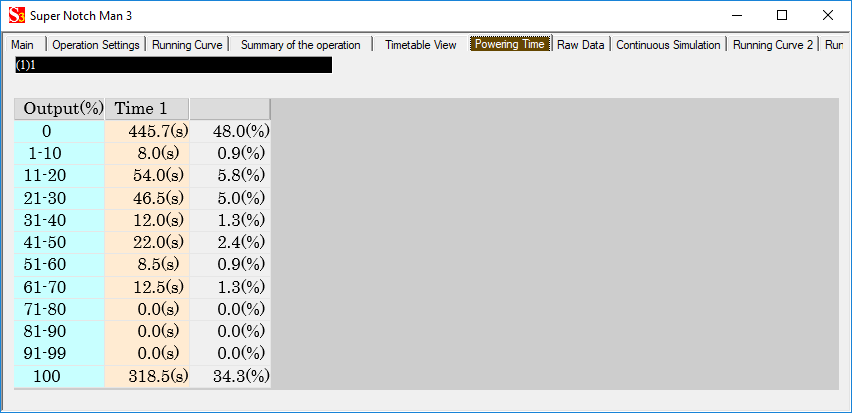
This tab shows the distribution of the powering ratio during the entire period of operation.
This tab shows the raw data of the running curve during the entire period of operation.
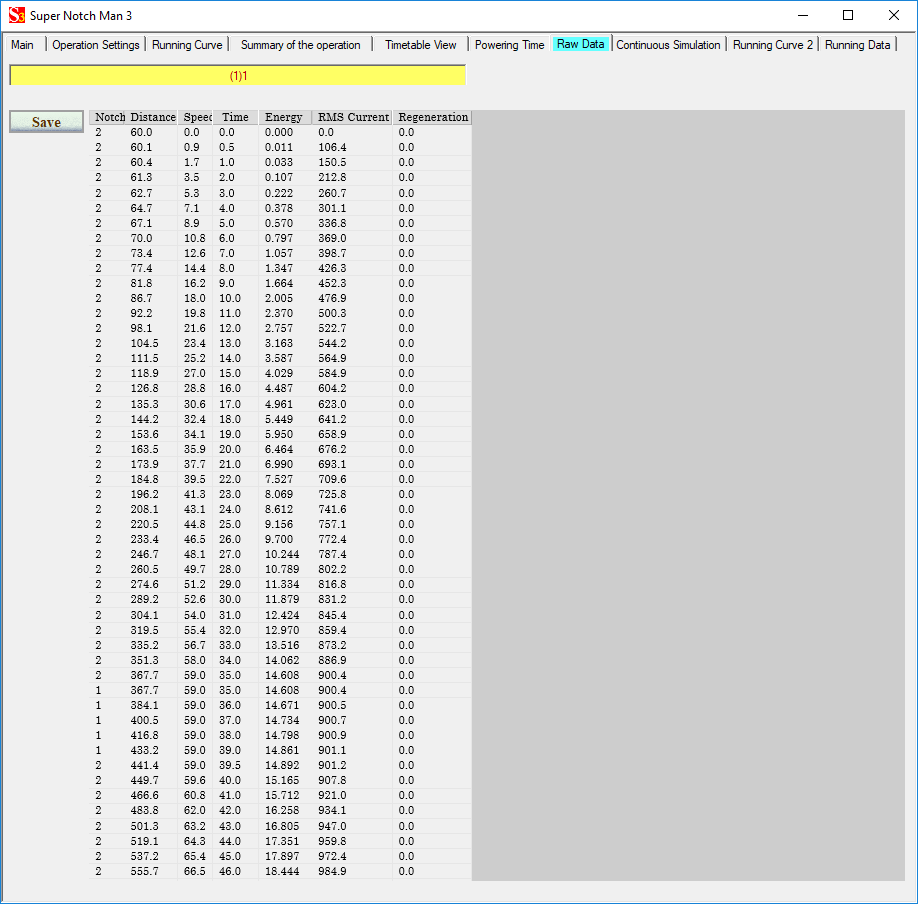
The notch number in this data is different from the number used in the edit mode.
| Notch number | Meaning |
| 2 | Full notch In the notch specified section, full notch is the specified notch. |
| 1 | The train is in cruising status |
| 0 | The train is in coasting status |
| -1 | The train is in braking status to stop or to lower its speed below the speed limit. |
| -2 | The train is in constant braking status |
©2021 JETconnect Co,. LTD All rights reserved.