
7.Continuous Simulation |
This is a function how a running curve varies when a single operational parameter changes from one value to another continuously.
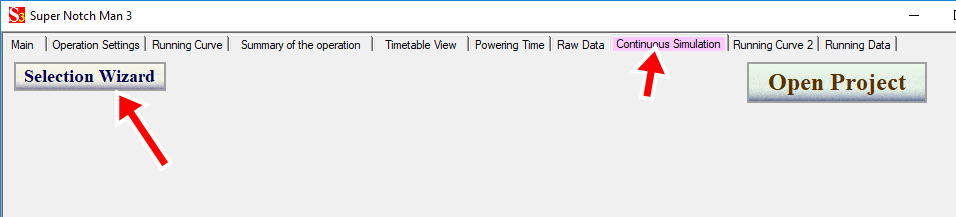
Click "Continuous Simulation" tab and click "Selection Wizard" button on it.
Select one train and one route using the same procedure described here.
When the wizard is completed, the tab changes like this.
The red framed part is the parameter area specific to this tab and others are same
as "Operation Settings" tab.
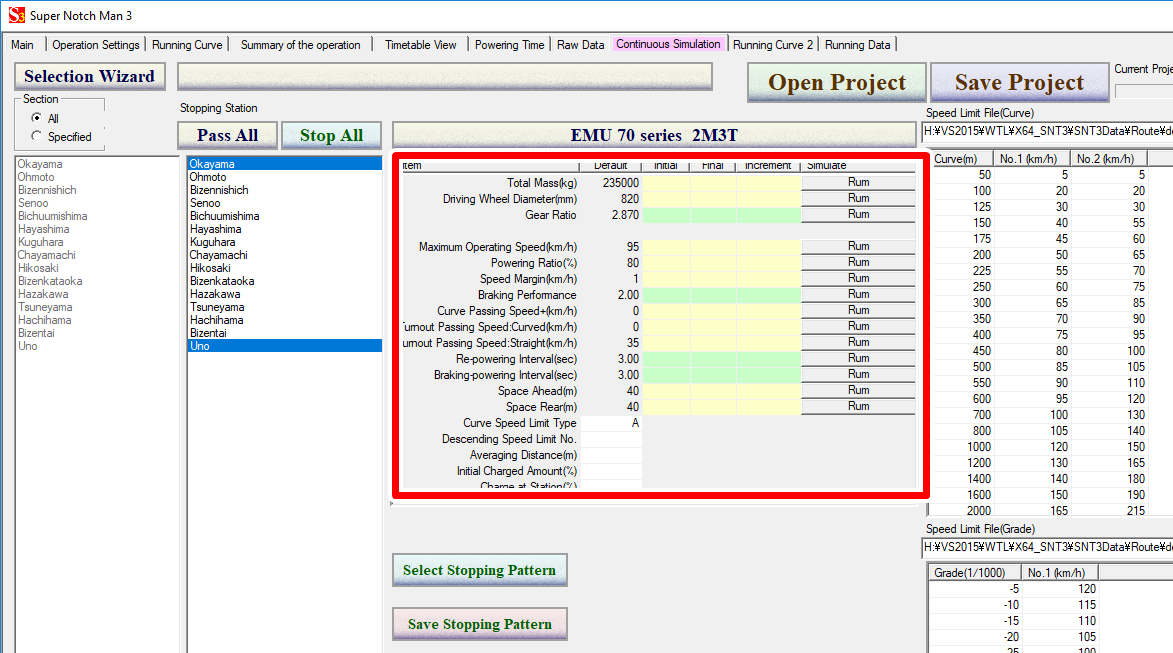
Pale green or pale yellow areas are input areas. Only integer values are allowed in pale yellow areas You should set the initial value, the final value and the incremental value like below.
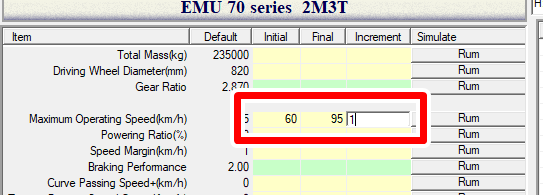
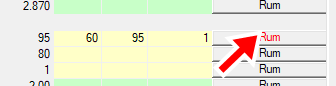
Then click "Run" button.
Or after pressing right allow key, "Run" button title color turns into
red and then press Enter key.
Then "Running curve 2" tab is activated and the calculating process is shown in the tab.
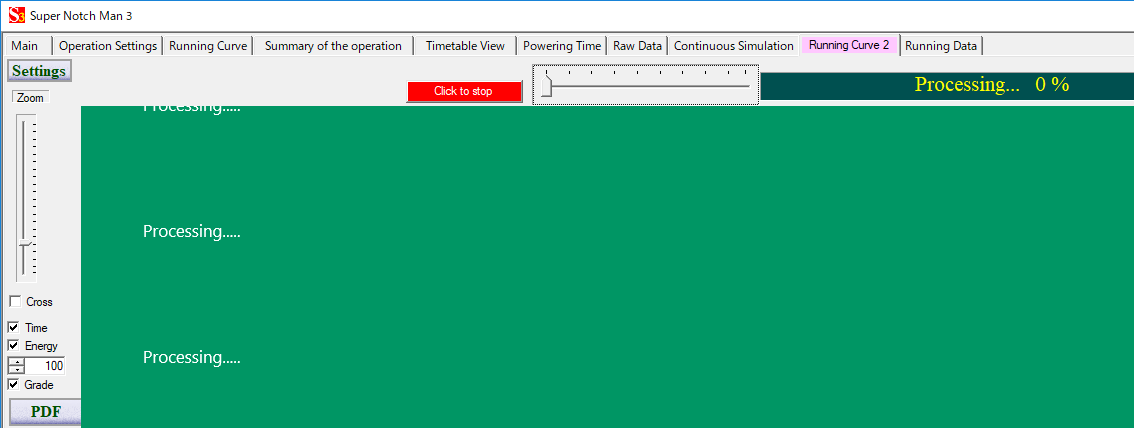
After completing the calculation, the running curve applied by the initial value set by above is displayed.
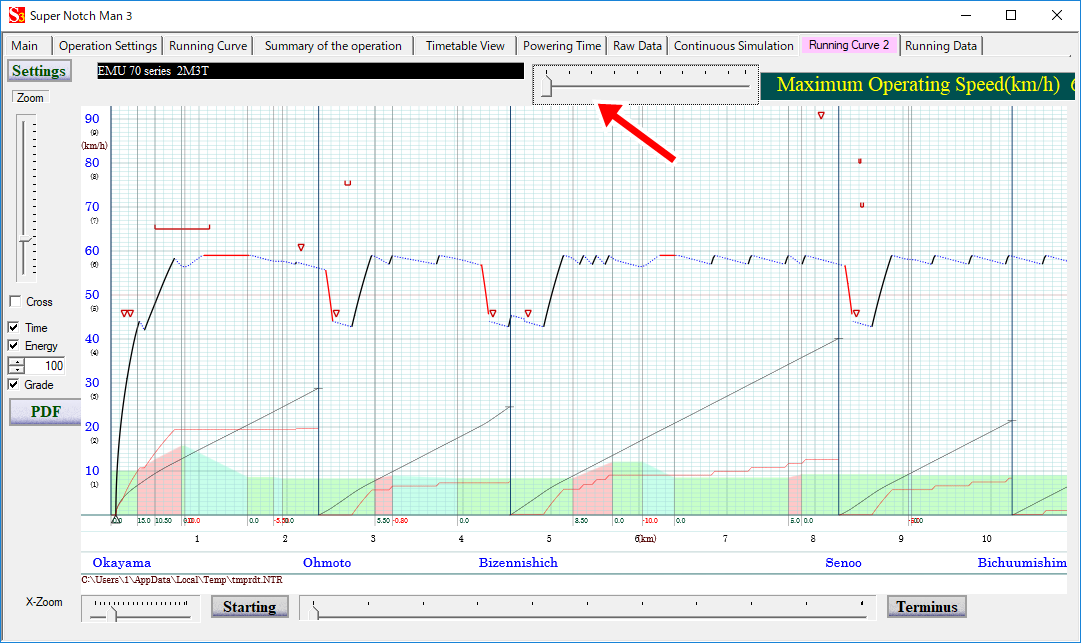
The red arrowed slider can change the parameter set above from the initial value
to the terminal value and the running curve changes according to the slider
position.
Other operation in this tab is similar
to "Running curve" tab.
The simulation result can be displayed as the numerical data.
Click "Running Data" tab and then the numerical data and its graph are displayed.
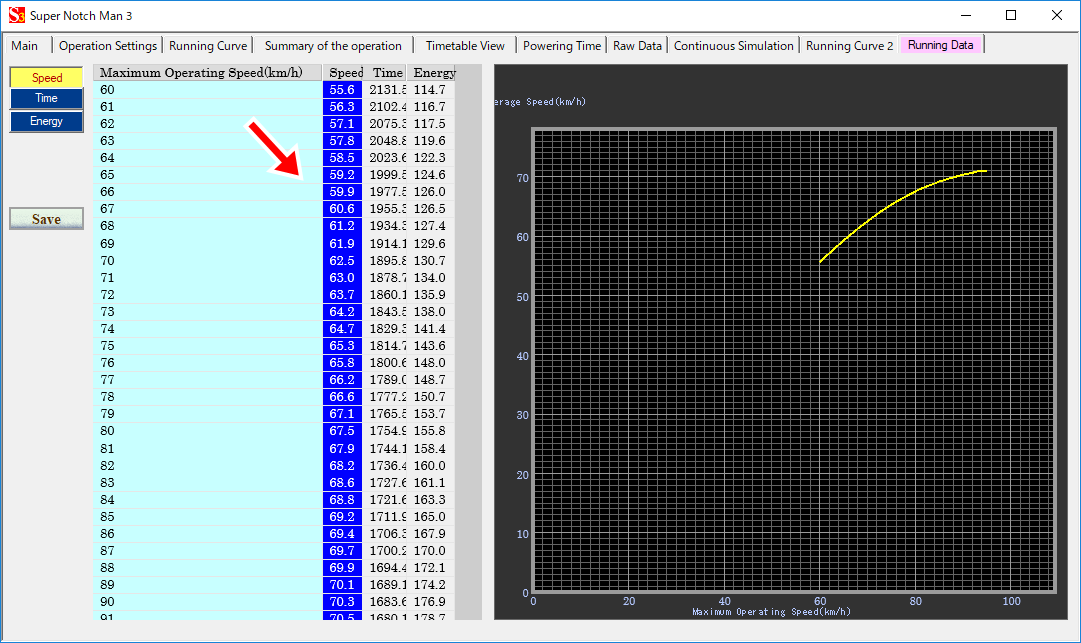
Click the column titled "Speed", "Time" and "Energy" and then the graph at the right side changes.
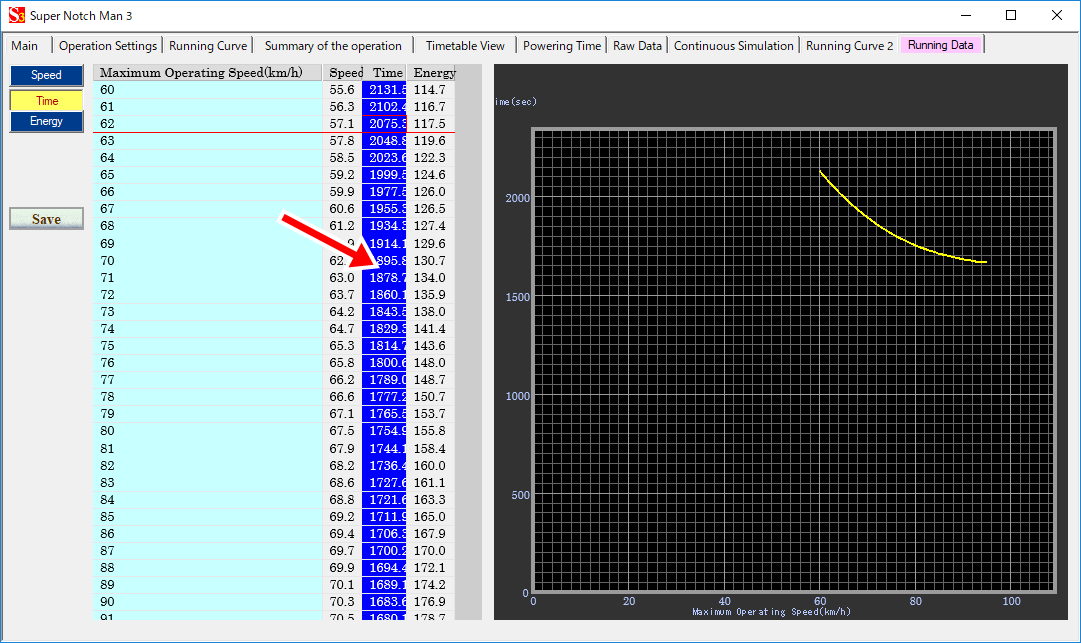
Numerical data can be saved as CSV format text file.
To save itt, click "Save" button.
The file explorer is displayed and you can specify a file name to save.
©2021 JETconnect Co,. LTD All rights reserved.